About Me

Hello , I'm Kayla, a fourth-year Data Science student at Michigan State University. I’m passionate about accessibility in technology and using data to create solutions that are clear, impactful, and easy to understand.

Through my coursework and projects, I’ve developed skills in data analysis, visualization, and working with real-world datasets using tools like Python, SQL, and cloud platforms. I enjoy breaking down complex problems and turning them into meaningful insights that others can use to make better decisions.

I’m always looking to expand my knowledge and continue growing as a data science professional, especially in areas that improve accessibility and user experience.

Projects

Thumbnail for Fast Food Unhealthiness vs Popularity Analysis

Fast Food Unhealthiness vs Popularity Analysis

Analyzed whether more unhealthy fast food menus are associated with higher popularity. Combined nutritional data with sales and store metrics to explore how health and business success relate across major U.S. fast food chains.

Python pandas matplotlib Jupyter Notebooks
More details

Problem

Fast food is widely consumed, but it is unclear whether unhealthier menus actually drive greater popularity. This project investigates whether chains with higher calorie, fat, and sodium content tend to generate more revenue and market presence.

Approach

Merged nutritional data with business metrics such as systemwide sales, average sales per unit, and total store count. Created a custom unhealthy score and used visualizations to compare nutrition patterns with popularity indicators.
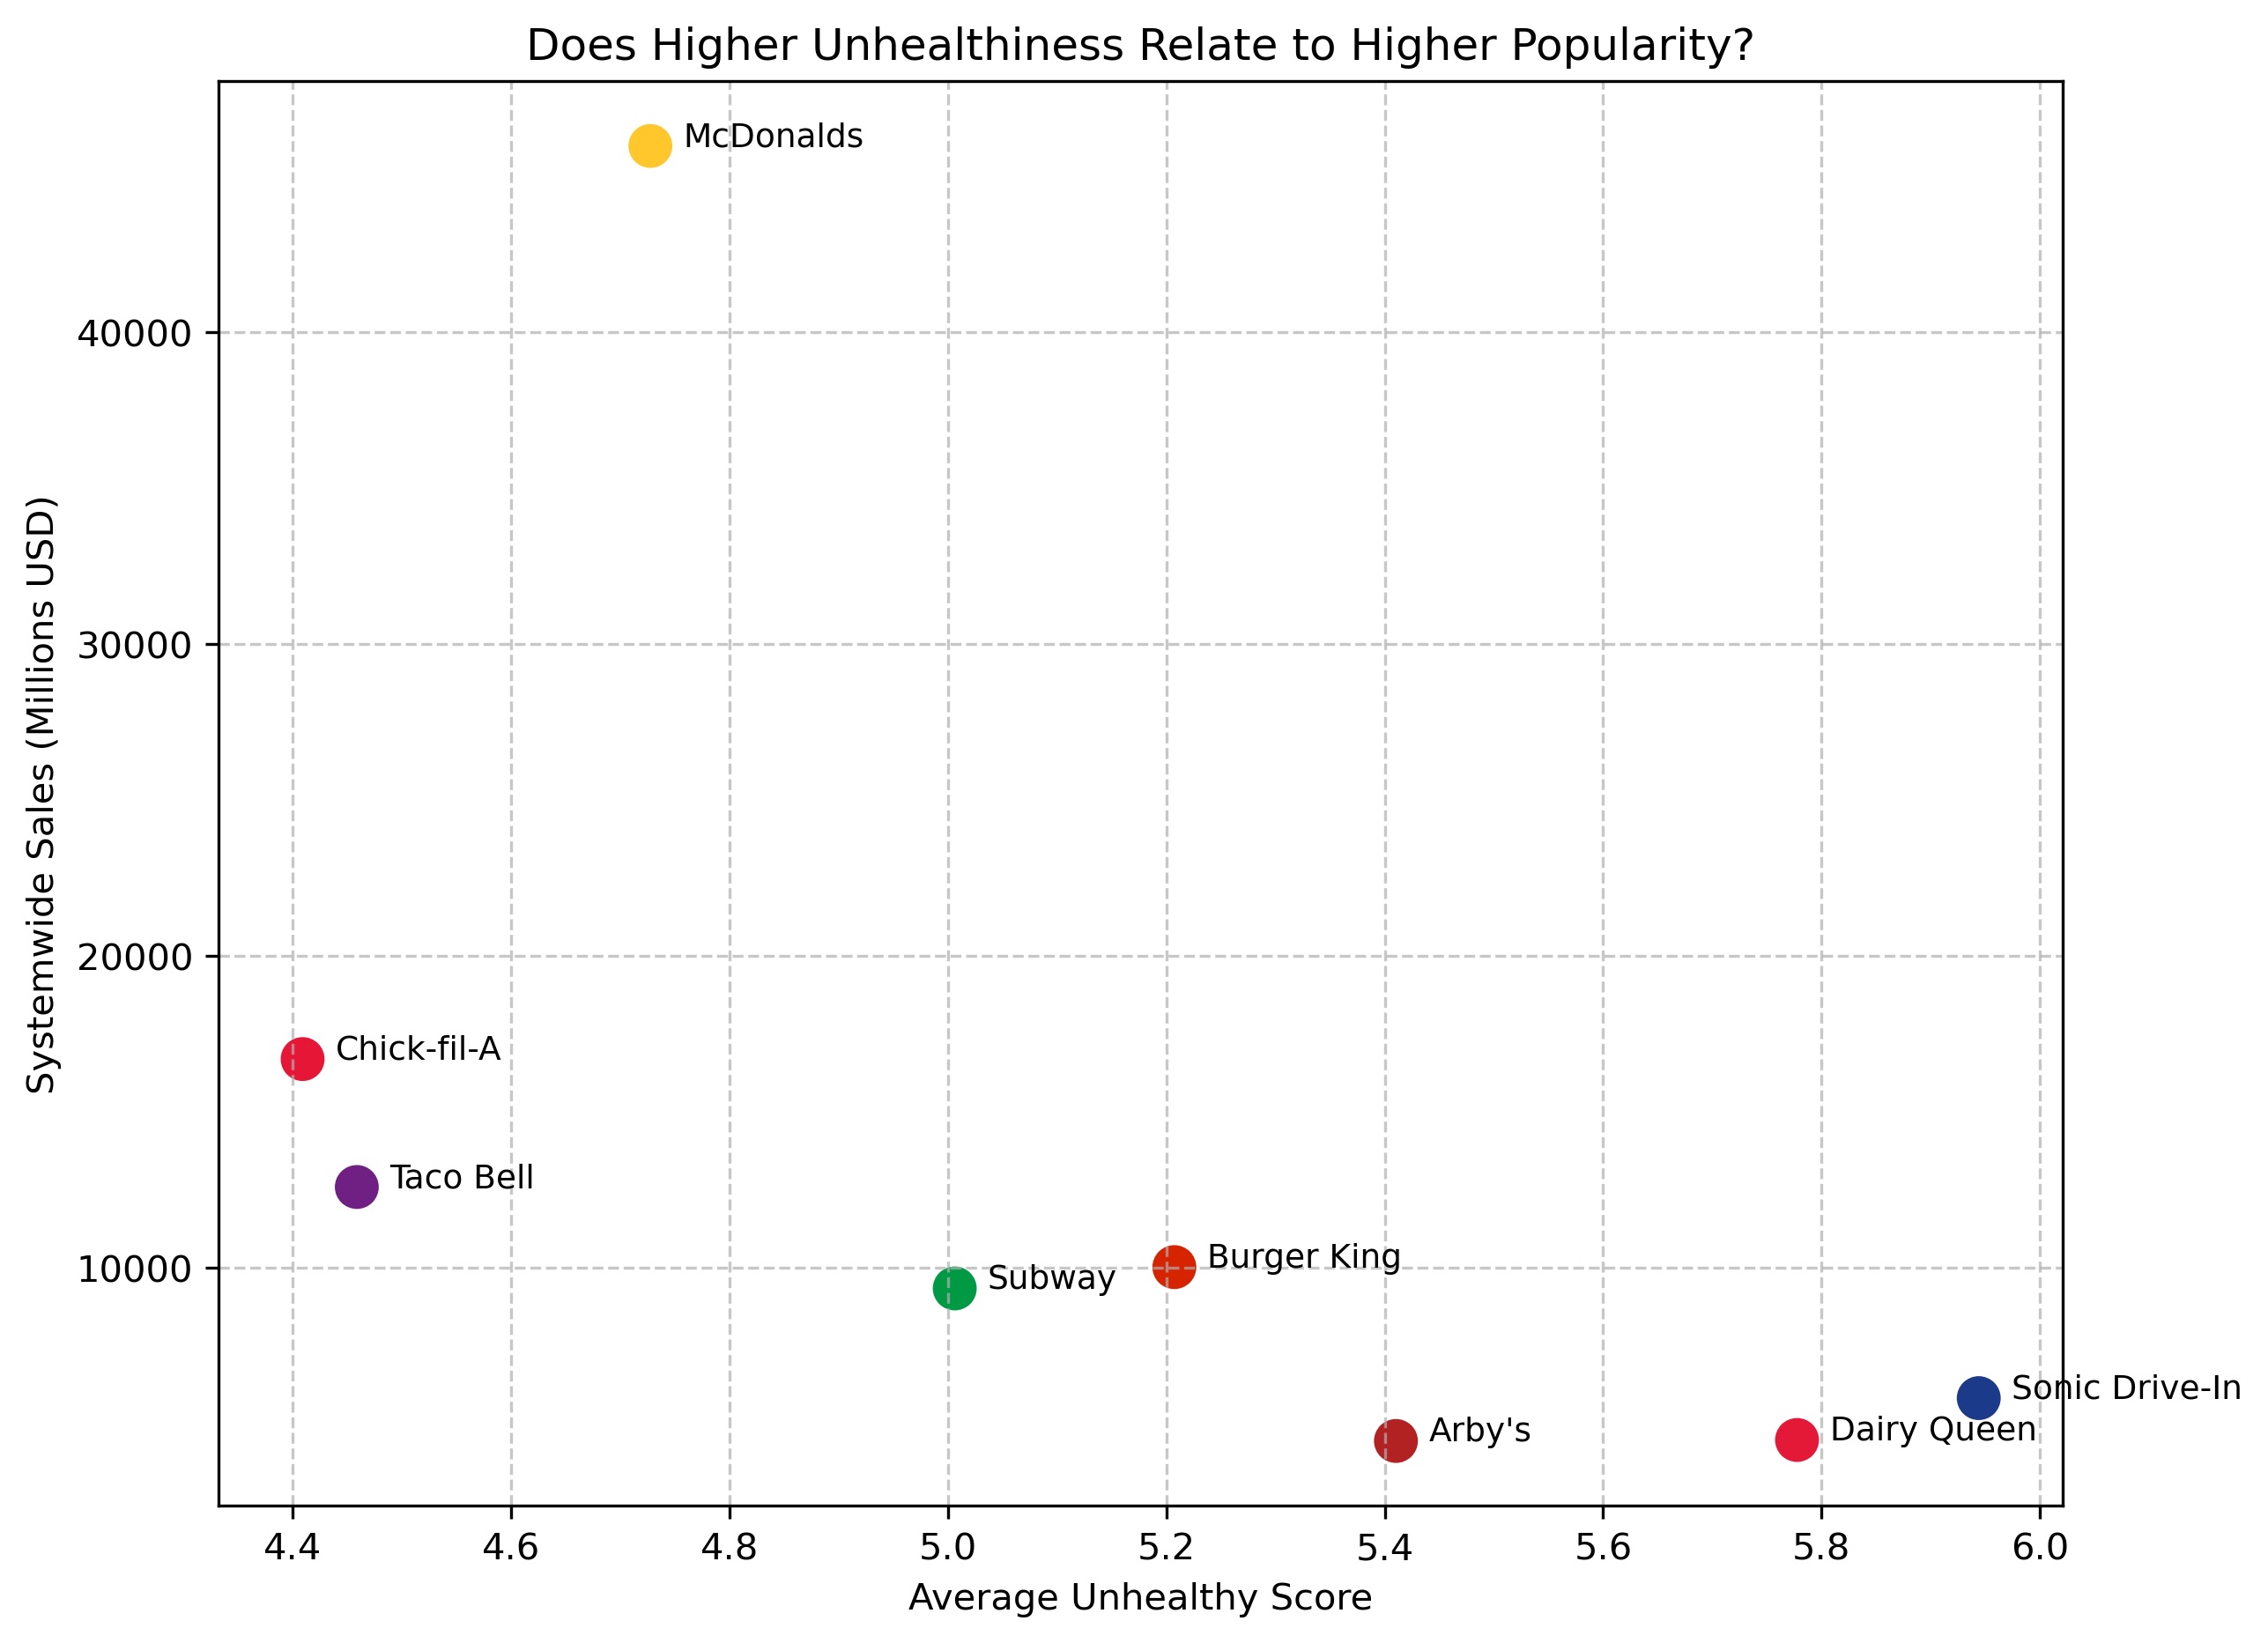
Results & Impact

The analysis showed that there was no perfect relationship between unhealthiness and popularity. McDonald's had the highest sales without being the most unhealthy, suggesting that branding, accessibility, and pricing also influence success.

Thumbnail for Cloud-Based Data Pipeline and Machine Learning with AWS

Cloud-Based Data Pipeline and Machine Learning with AWS

Developed a cloud-based data workflow using AWS services to store, query, and analyze large datasets. Demonstrates experience with scalable data processing and machine learning in a cloud environment.

AWS S3 AWS Athena AWS SageMaker Python SQL
More details

Problem

Processing large datasets locally can be inefficient and difficult to scale. This project explores how cloud computing tools can be used to efficiently store, query, and analyze data while supporting machine learning workflows.

Approach

Used AWS S3 to store datasets and organize data for analysis. Queried data using AWS Athena with SQL to perform filtering, aggregation, and transformations. Prepared datasets in the required format for machine learning and implemented models using AWS SageMaker, adjusting parameters and evaluating performance. This created a complete cloud-based data workflow from storage to analysis and modeling.

Results & Impact

Successfully demonstrated the use of AWS tools to build a scalable data pipeline. The project highlights how large datasets can be efficiently processed and analyzed in the cloud, and how machine learning workflows can be integrated into that pipeline. This reflects real-world data engineering and cloud computing practices. ChatGPT was used to help debug technical issues and clarify concepts related to AWS SageMaker, including data formatting requirements, feature dimension alignment, and Batch Transform workflows. All final implementation, testing, and interpretation of results were completed independently.

Thumbnail for Sales Data Analysis and Visualization Pipeline

Sales Data Analysis and Visualization Pipeline

Built a data analysis pipeline to process sales data and generate summary statistics and visualizations by region. Demonstrates data cleaning, transformation, and structured workflows.

Python pandas seaborn matplotlib Docker
More details

Problem

Raw sales data is often unstructured and difficult to analyze. This project focuses on transforming raw CSV datasets into meaningful insights about regional sales performance.

Approach

Combined multiple datasets, cleaned and structured the data, and created summary tables. Added a custom metric called revenue_per_unit and generated visualizations to compare regions.

Results & Impact

Produced clear summaries and visualizations of sales performance. The added metric provided deeper insight into efficiency, showing not just total revenue but how effectively it was generated. AI tools such as ChatGPT were used to assist with debugging, refining implementation, and improving documentation clarity.

Contact